Data and sources
Every number on our site, where it comes from, and how we got it.
Updated Nov 11, 2026 · 108 numbers
- Public data first. Our numbers come from official sources: Hawaiʻi DLIR, DBEDT, DHS and the Department of Taxation, the U.S. Bureau of Labor Statistics, BEA, Census, USDA and IRS, plus United For ALICE. Each one is logged in our research bank with its source and the date we checked it.
- “Our calculation” means simple math on official numbers, like hourly pay × 2,080 hours for a full-time year. Anyone can redo it with the figures shown.
- “Our estimate” means our own model or forecast, like a 2027 family budget or a 2028 wage that isn’t set yet. The method note under each table says how we made it.
- “Checked against the source” means we read the number in the original source. “From the source, check pending” means it comes from a named source we haven’t re-checked yet.
- Since the raises began. Our charts show what changed over time, not what caused it.
Homepage charts
- Top of the homepage
- What a living wage pays for
- Households
- Who earns the least
- One family
- Pay and prices
- Unemployment
- Low-wage jobs
- The economy
- Places that pay more
Also in the full story
Only on this page
For reporters and lawmakers
Free to use with credit to Living Wage Hawaiʻi. The press kit has every chart (PNG), the data (CSV), a one-page fact sheet and our logo. Questions go to info@livingwagehawaii.com.
Download the press kit (ZIP)Homepage · Top of the homepage
One job should be enough.
| Number | What it means | Source | Year | Status |
|---|---|---|---|---|
| $18 | Hawaiʻi’s minimum wage from Jan 1, 2028, the last raise in current law (Act 114 of 2022). Today it is $16. | Hawaiʻi DLIR; Act 114 (2022)Research Bank F0002, F0005 | 2028 | Checked against the source |
| ~$30 an hour | A living wage for each of two working parents in a family of four (two adults, an infant and a preschooler). $124,500 a year ÷ 2 parents ÷ 2,080 hours = $29.92. | Our estimate from United For ALICE (State of ALICE in Hawaiʻi 2026) and DBEDT’s price forecastResearch Bank F0102, F0435, F0056 | 2027 | Our estimate |
| $12 an hour | The gap between the $18 minimum and a ~$30 living wage. $30 − $18. | Our calculation from Hawaiʻi DLIR and United For ALICEResearch Bank F0534 | 2028 | Our calculation |
| About $37,500 vs $62,500 a year | $18 and $30 an hour for one full-time job ($37,440 and $62,400, × 2,080 hours), rounded to the nearest $500, before taxes. | Our calculationResearch Bank F1417, F0022, F0534 | 2028 | Our calculation |
| $22.81 | DBEDT’s self-sufficiency budget for two adults, a preschooler and a school-age child ($94,889 a year, state average), split over two full-time earners. | Our calculation from DBEDT, Self-Sufficiency Income Standard (Dec 2025)Research Bank F0122, F1419, F1421 (confirmed, F1419) | 2024 | Checked against the source |
| ~$30 | Our ALICE-based living wage for each of two working parents (see above). The middle of three measures of need. | Our estimate from United For ALICE and DBEDTResearch Bank F0102, F0435 | 2027 | Our estimate |
| $37.64 | MIT Living Wage Calculator, each of two working adults with two children. | MIT Living Wage CalculatorResearch Bank F0060 | 2026 | Checked against the source |
| $27.08 | Hawaiʻi’s median hourly wage. ~$30 is above it. | BLS OEWS May 2025Research Bank F0340, F1420 | May 2025 | Checked against the source |
How we got it. Yearly = hourly × 2,080 hours (40 a week × 52), before taxes, rounded to the nearest $500. The three measures of need use different families and years: DBEDT (2024, a preschooler and a school-age child), our ALICE estimate (2027, an infant and a preschooler) and MIT (2026, two children).
Homepage · What a living wage pays for
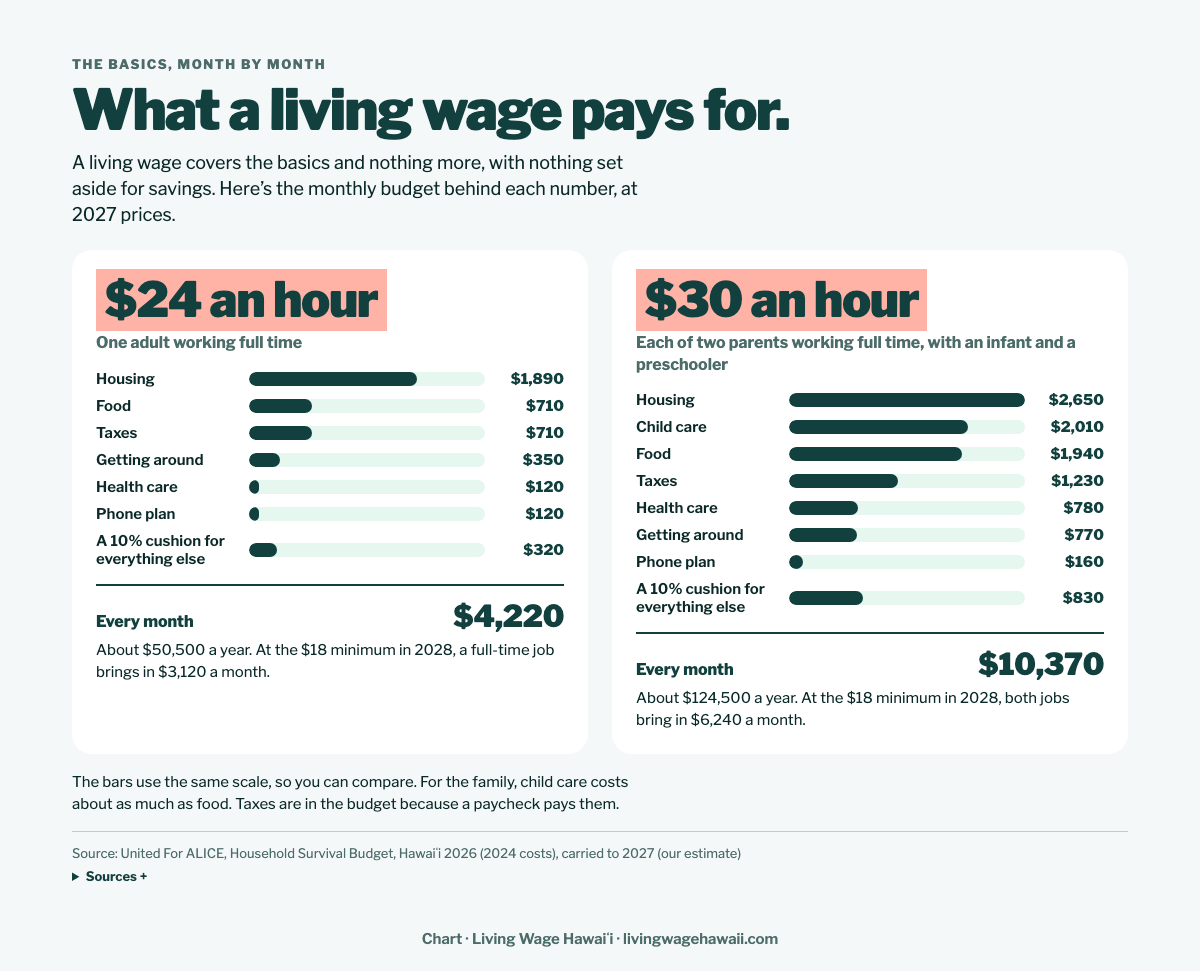
What a living wage pays for.
| Number | What it means | Source | Year | Status |
|---|---|---|---|---|
| $4,220 a month | Our 2027 estimate of one adult’s basic budget: housing $1,890, food $710, taxes $710, getting around $350, phone $120, health care $120, 10% cushion $320. | Our estimate from United For ALICEResearch Bank F1459 | 2027 | Our estimate |
| $24.32 an hour | That budget for one full-time job: $50,584 a year ÷ 2,080 hours. | Our estimate from United For ALICEResearch Bank F0443 | 2027 | Our estimate |
| $10,370 a month | Our 2027 estimate for two parents, an infant and a preschooler: housing $2,650, child care $2,010, food $1,940, taxes $1,230, 10% cushion $830, health care $780, getting around $770, phone $160. | Our estimate from United For ALICEResearch Bank F1460 | 2027 | Our estimate |
| $29.92 an hour | That budget split over two full-time parents: $124,465 ÷ 2 ÷ 2,080. | Our estimate from United For ALICEResearch Bank F1460 | 2027 | Our estimate |
| $3,817 · $9,392 a month | ALICE’s own Household Survival Budgets at 2024 costs: one adult; two adults with an infant and a preschooler. | United For ALICE, State of ALICE in Hawaiʻi 2026Research Bank F1452, F1453 | 2024 | Checked against the source |
| $1,820 a month | Child care in ALICE’s 2024 family budget, its second-biggest cost after housing ($2,405). | United For ALICE, State of ALICE in Hawaiʻi 2026Research Bank F1454 | 2024 | Checked against the source |
How we got it. ALICE’s 2024 line items carried to 2027 with DBEDT’s Honolulu price forecast (× 1.10435), each rounded to $10 so they add to the rounded monthly total. Taxes are in the budget because a paycheck pays them. The cushion is ALICE’s 10% for other costs. These numbers measure need; they are not in any bill.
Homepage · Households
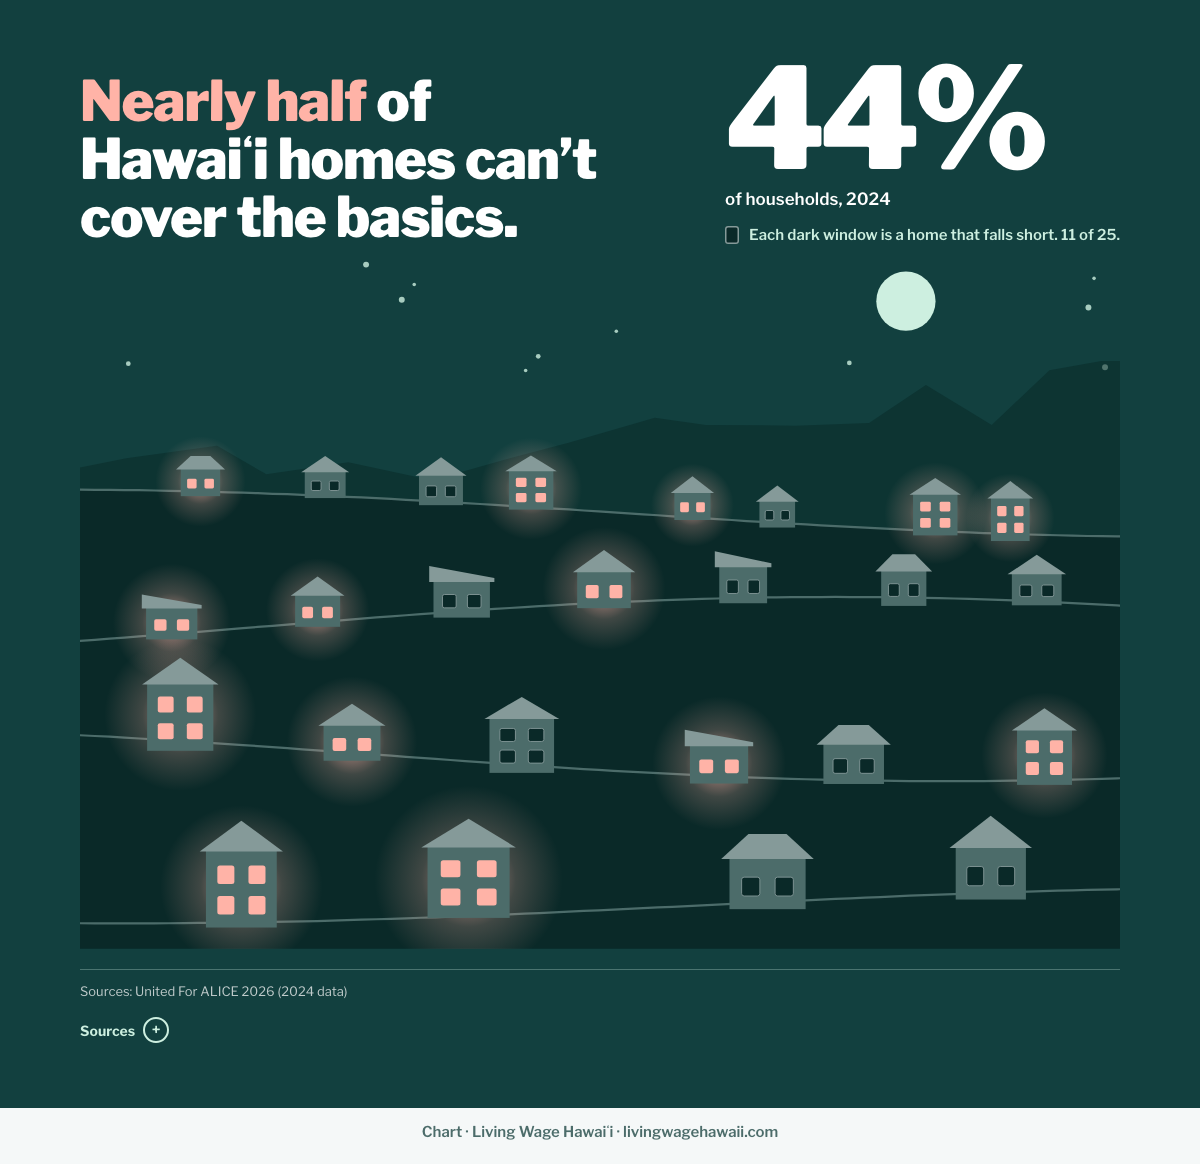
Nearly half of Hawaiʻi homes can’t cover the basics.
| Number | What it means | Source | Year | Status |
|---|---|---|---|---|
| 44% | Hawaiʻi households below the ALICE line: they can’t cover housing, child care, food, transportation, health care, a phone plan and taxes. | United For ALICE, State of ALICE in Hawaiʻi 2026Research Bank F0410 | 2024 | Checked against the source |
| 11 of 25 | 44% drawn as lit windows (11 ÷ 25 = 44%). An illustration, not a real street. | Our calculation from United For ALICEResearch Bank F0410 | 2024 | Checked against the source |
Homepage · Who earns the least
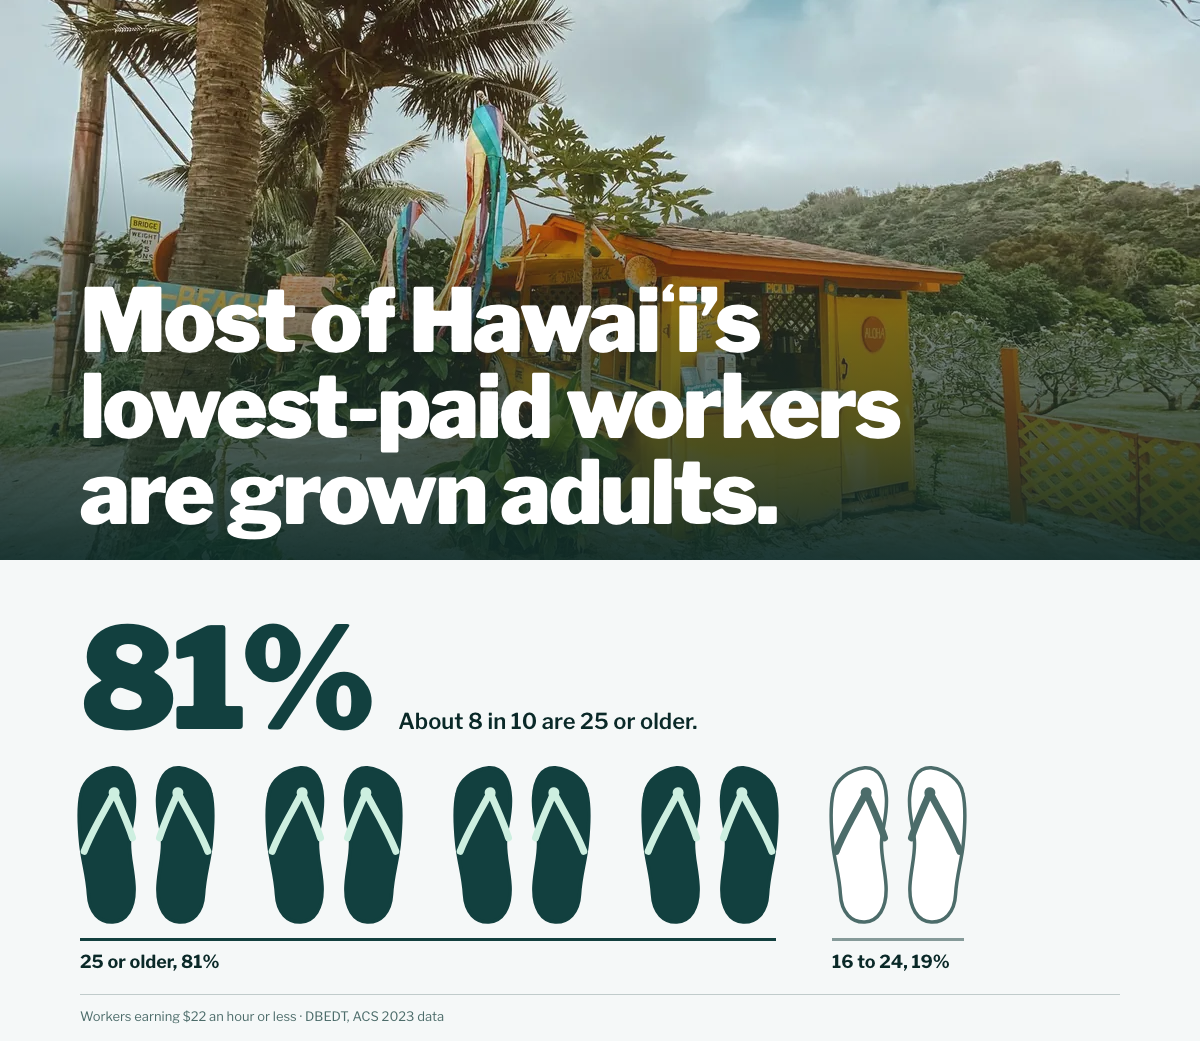
Most of Hawaiʻi’s lowest-paid workers are grown adults.
| Number | What it means | Source | Year | Status |
|---|---|---|---|---|
| 81% | Workers earning $22 an hour or less who are 25 or older (about 8 in 10). | DBEDT, Minimum Wage in Hawaiʻi: 2025 Update (Table E-1, ACS 2023)Research Bank F0295 | 2023 | Checked against the source |
| 19% | Workers earning $22 an hour or less who are 16 to 24 (100 − 81). | Our calculation from DBEDTResearch Bank F0295 | 2023 | Checked against the source |
Homepage · One family
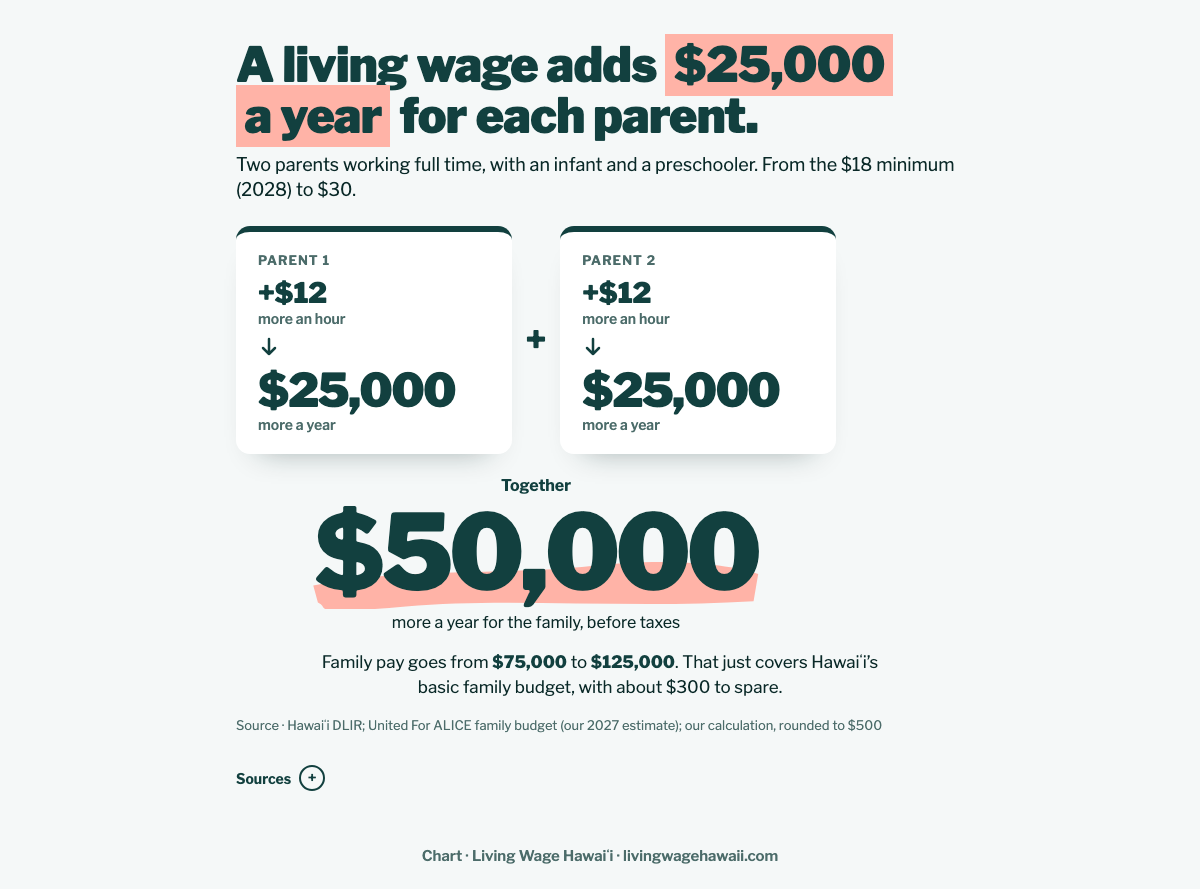
A living wage adds $25,000 a year for each parent.
| Number | What it means | Source | Year | Status |
|---|---|---|---|---|
| $25,000 a year for each parent | $30 instead of the $18 minimum: $12 × 2,080 hours = $24,960, rounded. | Our calculationResearch Bank F0534 | 2028 | Our calculation |
| $50,000 more for the family | Both parents ($49,920), before taxes. | Our calculationResearch Bank F0552 | 2028 | Our calculation |
| $75,000 → $125,000 | Family pay at $18 and at $30 ($74,880 → $124,800), rounded. | Our calculationResearch Bank F0552, F0022 | 2028 | Our calculation |
| About $300 to spare | Two parents at $30 ($124,800) just cover the 2027 basic family budget for two adults, an infant and a preschooler ($124,465), $335 to spare. | Our calculation from United For ALICE and DBEDTResearch Bank F1422, F0435 | 2027 | Our calculation |
How we got it. Two parents working full time (2,080 hours each) with an infant and a preschooler, the family behind the ~$30. Pay only, before taxes, rounded to the nearest $500. The basic family budget is United For ALICE’s Household Survival Budget ($112,704 at 2024 costs) carried to 2027 with DBEDT’s Honolulu price forecast (our estimate).
Homepage · Pay and prices
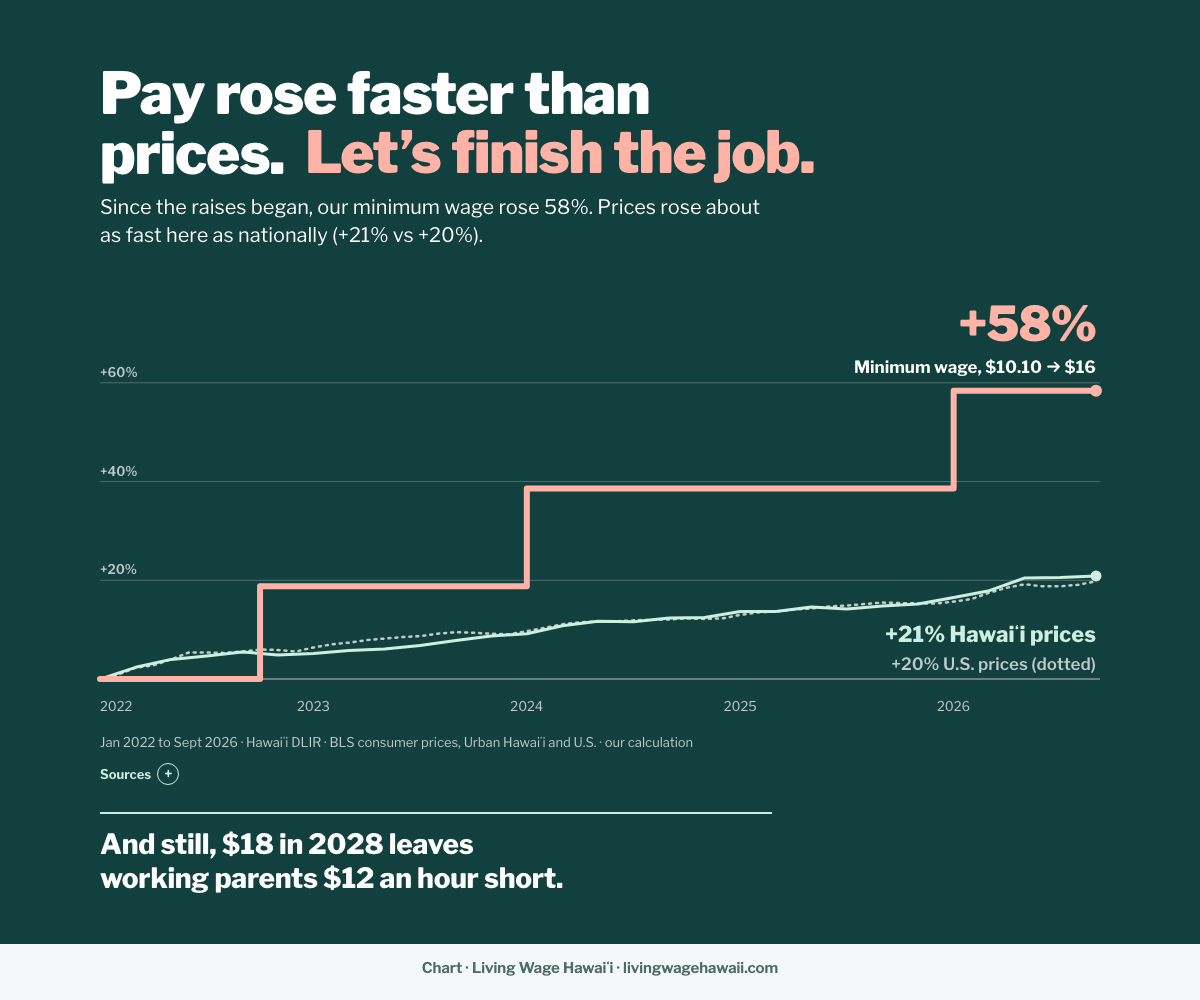
Pay rose faster than prices. Let’s finish the job.
| Number | What it means | Source | Year | Status |
|---|---|---|---|---|
| +58% | Hawaiʻi’s minimum wage, $10.10 (Jan 2022) to $16 (Jan 2026). $16 ÷ $10.10 = 1.584. | Our calculation from Hawaiʻi DLIRResearch Bank F1226, F0005 | Jan 2022–Sept 2026 | Our calculation |
| +21% | Prices in urban Hawaiʻi (CPI-U, all items): 304.988 → 368.586. | Our calculation from BLS consumer prices, Urban HawaiʻiResearch Bank F1231, F1227 | Jan 2022–Sept 2026 | Our calculation |
| +20% | U.S. prices (CPI-U, U.S. city average): 281.148 → 336.940. | Our calculation from BLS consumer prices, U.S.Research Bank F1231, F1228, F1229 | Jan 2022–Sept 2026 | Our calculation |
| 304.988 | Urban Hawaiʻi price index, January 2022. | BLS CPI-U Urban Hawaiʻi, series CUURS49FSA0Research Bank F1227 | Jan 2022 | Checked against the source |
| 368.586 | Urban Hawaiʻi price index, September 2026. | BLS CPI-UResearch Bank F0216 | Sept 2026 | Checked against the source |
| $10.10 → $12 → $14 → $16 | Minimum wage steps: Jan 2022, Oct 1 2022, Jan 1 2024, Jan 1 2026. | Hawaiʻi DLIR; Act 114 (2022)Research Bank F0005, F0004 | 2022–2026 | Checked against the source |
| $12 an hour | The gap between the $18 minimum and a ~$30 living wage. $30 − $18. | Our calculation from Hawaiʻi DLIR and United For ALICEResearch Bank F0534 | 2028 | Our calculation |
How we got it. The percentages are our math from the official figures. The chart shows what happened to pay and prices over this period, not what caused it. Longer windows show the same pattern: 2015 to 2025 the wage rose 81% while Honolulu prices rose 34% (F0020).
Homepage · Unemployment
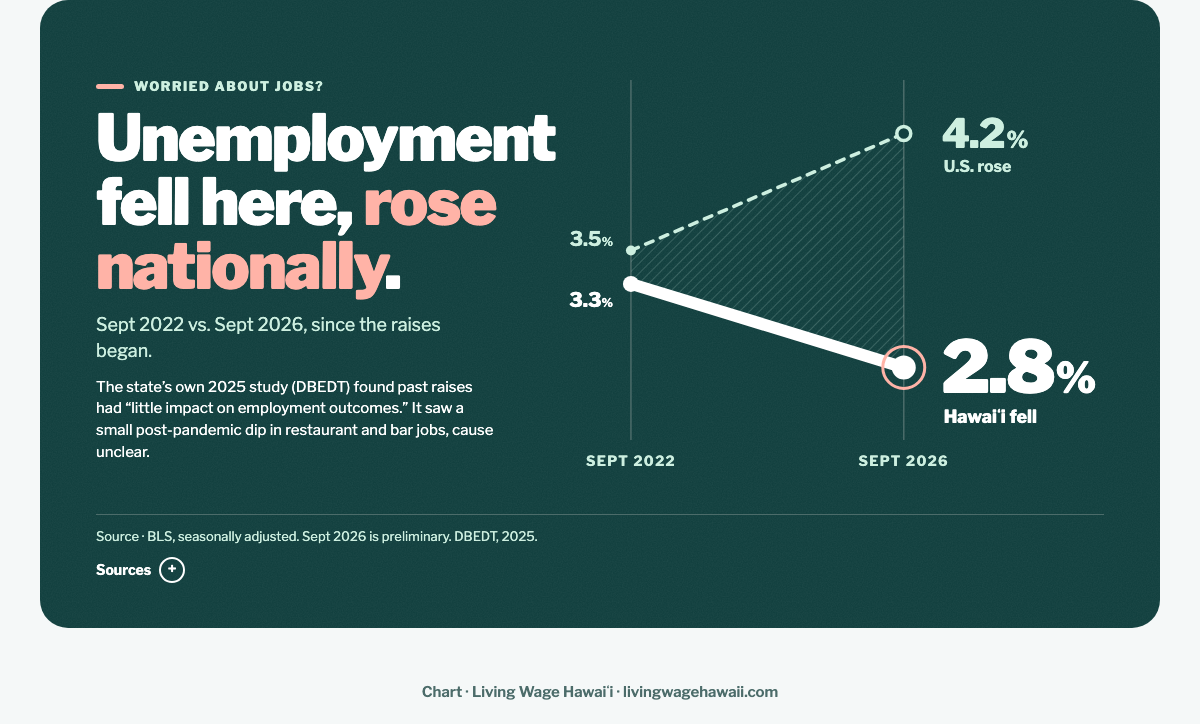
Unemployment fell here, rose nationally.
| Number | What it means | Source | Year | Status |
|---|---|---|---|---|
| 3.3% → 2.8% | Hawaiʻi unemployment rate, seasonally adjusted (down 0.5 points). Sept 2026 is preliminary. | BLS Local Area Unemployment Statistics (Hawaiʻi)Research Bank F0317, F0809 | Sept 2022–Sept 2026 | Checked against the source |
| 3.5% → 4.2% | U.S. unemployment rate, seasonally adjusted (up 0.7 points). | BLS Current Population Survey (U.S.)Research Bank F0317, F0809 | Sept 2022–Sept 2026 | Checked against the source |
| 2.1% | Hawaiʻi’s low point in between (Aug–Sept 2025). It has risen since. | BLS LAUSResearch Bank F0808 | Sept 2025 | Checked against the source |
| Below the U.S. in all 48 months | Hawaiʻi’s rate was lower than the U.S. rate every month with data (no October 2025 figure, federal shutdown). | BLS LAUS (LASST150000000000003) and CPS (LNS14000000)Research Bank F1441 | Sept 2022–Sept 2026 | Checked against the source |
| “Little impact on employment outcomes” | The state’s own 2025 study (DBEDT) of past Hawaiʻi minimum wage raises, which also found they generally increased income and wages. | DBEDT, The Minimum Wage in Hawaiʻi: 2025 Update (August 2025), Executive Summary, p. iiiResearch Bank F1414, F1415 | Raises through 2024 | Checked against the source |
| Small post-pandemic dip | DBEDT saw restaurant and bar jobs in Honolulu slightly decrease after the pandemic, more so statewide and on Maui. How much is the minimum wage vs tourism’s recovery and the Maui wildfires is unclear. | DBEDT, The Minimum Wage in Hawaiʻi: 2025 Update (August 2025), Executive Summary, p. iiiResearch Bank F1416, F1413 | 2022–2024 | Checked against the source |
How we got it. September 2022 is the month before the wage rose to $12. BLS revises these numbers each spring. This shows what happened since the raises began, not what caused it.
Homepage · Low-wage jobs
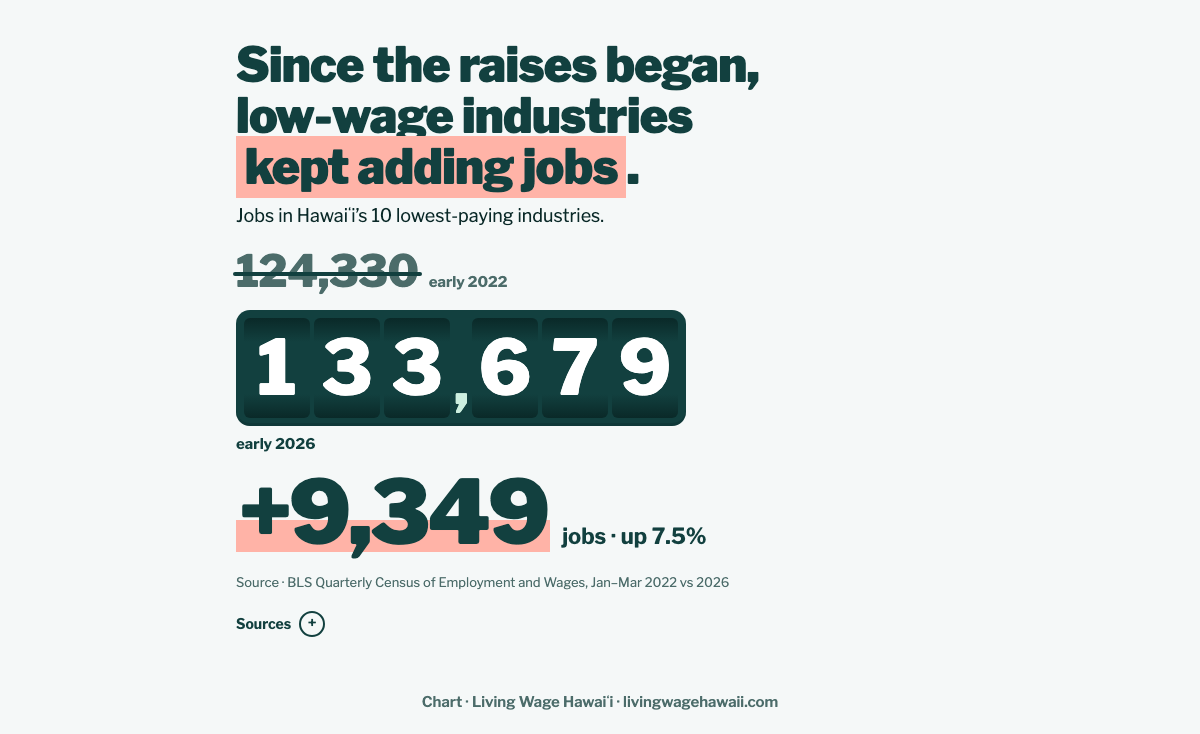
Since the raises began, low-wage industries kept adding jobs.
| Number | What it means | Source | Year | Status |
|---|---|---|---|---|
| 124,330 → 133,679 | Private jobs in Hawaiʻi’s 10 lowest-paying industries (food service, retail, child care and others), January–March average. | BLS QCEWResearch Bank F1234 | Q1 2022–Q1 2026 | Checked against the source |
| +9,349 · up 7.5% | The change in those jobs. | BLS QCEWResearch Bank F1234 | Q1 2022–Q1 2026 | Checked against the source |
| $10.10 → $16 → $18 | Minimum wage over these years, and in 2028. | Hawaiʻi DLIR; Act 114 (2022)Research Bank F0005 | 2022–2028 | Checked against the source |
How we got it. Industries ranked by early-2022 weekly pay. Jobs and raises happened together; this does not show that one caused the other. In early 2022, jobs were still recovering from the 2020 shutdown.
Homepage · The economy
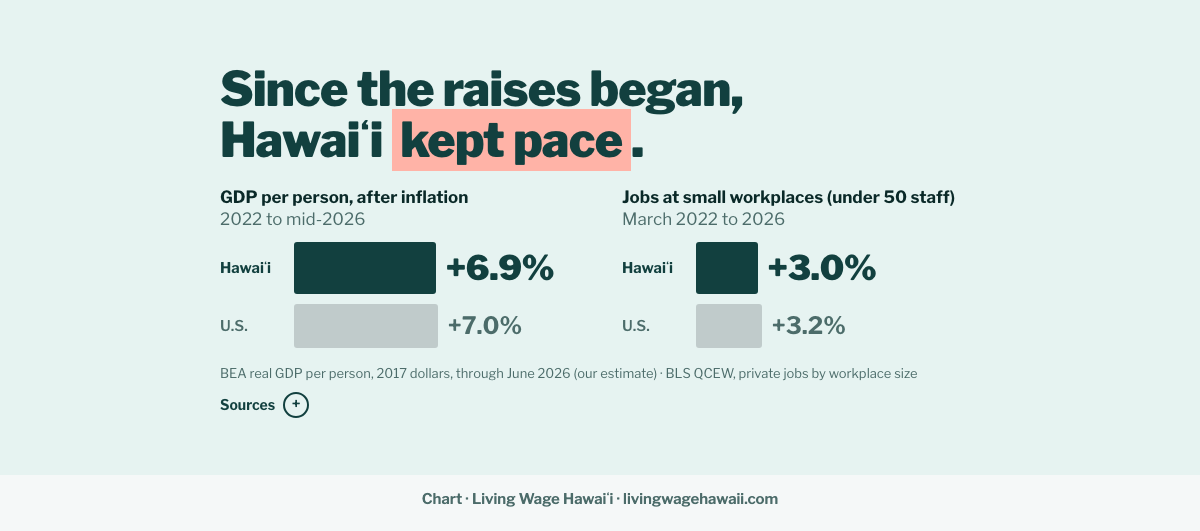
Since the raises began, Hawaiʻi kept pace.
| Number | What it means | Source | Year | Status |
|---|---|---|---|---|
| +6.9% vs +7.0% | Real GDP per person, Hawaiʻi vs U.S. Hawaiʻi $61,115 → $65,329; U.S. $66,108 → $70,709 (2017 dollars). The U.S. was slightly ahead. | Our estimate from BEA real GDP by state and populationResearch Bank F1343, F1338, F1236 | 2022 to year ending June 2026 | Our estimate |
| +6.8% to +7.0% · +6.7% to +7.2% | GDP per person with other reasonable population choices (July 2025 held flat, or July 2026 extrapolated), Hawaiʻi · U.S. | Our estimate from BEA real GDP by state and populationResearch Bank F1450, F1451 | 2022 to year ending June 2026 | Our estimate |
| +3.0% vs +3.2% | Private jobs at small workplaces (under 50 staff), Hawaiʻi vs U.S. Hawaiʻi 249,204 → 256,722; U.S. 56,115,199 → 57,903,375. The U.S. was slightly ahead. | BLS Quarterly Census of Employment and Wages (Q1 size classes 1–4)Research Bank F1307, F1309, F1310 | March 2022–March 2026 | Checked against the source |
| Peak 257,880 in 2023 | Hawaiʻi small-workplace jobs each March: 249,204 (2022), 257,880 (2023), 257,276 (2024), 257,023 (2025), 256,722 (2026). Up in the first year, then flat to slightly down. | BLS QCEW, Q1 size-class data (size classes 1–4, private, all industries, month 3)Research Bank F1449 | March 2022–March 2026 | Checked against the source |
| 6.4% vs 9.7% | Whole-economy real GDP growth, Hawaiʻi vs U.S. (Hawaiʻi’s population fell slightly, which lifts per-person numbers). | Our calculation from BEA real GDP by stateResearch Bank F1342 | 2022 to year ending June 2026 | Our calculation |
| +0.7% vs +2.2% | Real GDP, Apr–Jun 2026 vs a year earlier, Hawaiʻi vs U.S. | Our calculation from BEA real GDP by stateResearch Bank F1317 | Q2 2026 | Our calculation |
| About half | Share of Hawaiʻi private jobs at workplaces under 50 staff (256,722 of 519,111). | Our calculation from BLS QCEWResearch Bank F1308 | March 2026 | Our calculation |
| 15,257 → 15,528 | Hawaiʻi workplaces with 5–49 staff (up 1.8%; U.S. up 2.6%). | Our calculation from BLS QCEWResearch Bank F1316 | Q1 2022–Q1 2026 | Our calculation |
How we got it. GDP per person is our estimate: BEA real GDP (millions of chained 2017 dollars) ÷ population. 2022 uses 2022’s four quarters and midyear population. The latest uses the four quarters Jul 2025–Jun 2026 and an estimated Jan 1, 2026 population (Census July 2025 plus half of the past year’s change). Other reasonable population choices give Hawaiʻi +6.8% to +7.0% and the U.S. +6.7% to +7.2%. QCEW counts workplaces (each store or office), not companies.
Homepage · Places that pay more
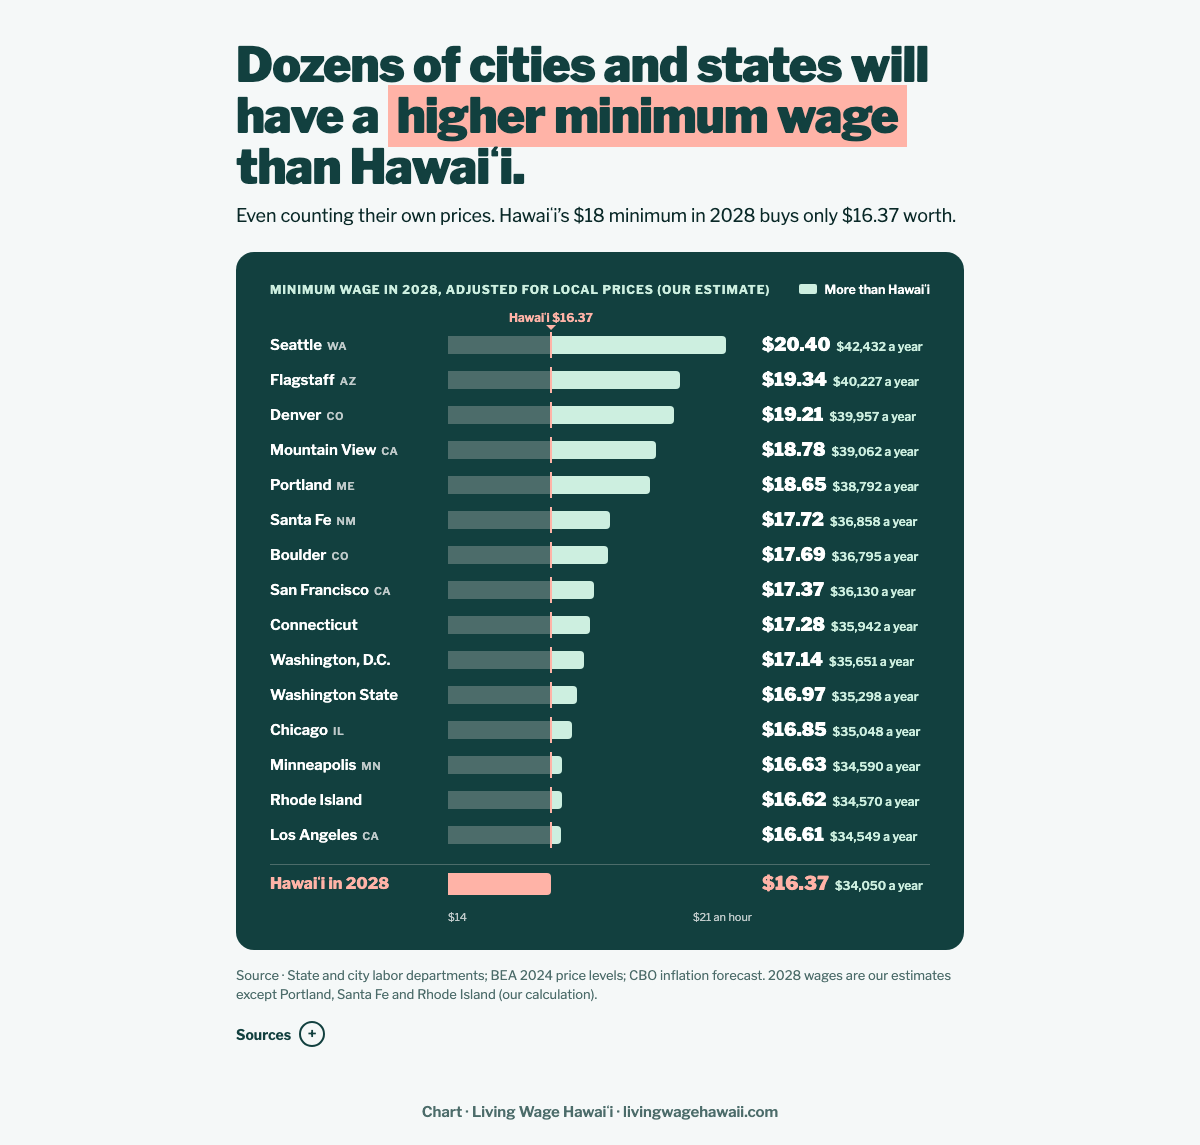
Dozens of cities and states will have a higher minimum wage than Hawaiʻi.
| Number | What it means | Source | Year | Status |
|---|---|---|---|---|
| $16.37 | Hawaiʻi’s $18 (2028) at U.S.-average prices: $18 ÷ 109.951 (BEA 2024 price level) × 100. $34,050 a year full time. | Our calculation from BEA Regional Price ParitiesResearch Bank F0013, F1216, F0169 | 2028 wage, 2024 prices | Our calculation |
| $16.22 | Hawaiʻi’s $18 at Honolulu’s metro price level instead of the state’s: $18 ÷ 110.961 × 100. | Our calculation from BEA Regional Price ParitiesResearch Bank F1440, F1184 | 2028 wage, 2024 prices | Our calculation |
| $20.40 | Seattle, WA. Our estimate of its Jan 2028 wage ($22.67) at U.S.-average prices. | LWH calculation from BEA RPP 2024 (MARPP/SARPP), wage sources above, CBO inflation forecastResearch Bank F1258, F1243 | 2028 | Our estimate |
| $19.34 | Flagstaff, AZ ($19.40 estimated). | LWH calculation from BEA RPP 2024 (MARPP/SARPP), wage sources above, CBO inflation forecastResearch Bank F1250 | 2028 | Our estimate |
| $19.21 | Denver, CO ($20.32 estimated). | LWH calculation from BEA RPP 2024 (MARPP/SARPP), wage sources above, CBO inflation forecastResearch Bank F1249 | 2028 | Our estimate |
| $18.78 | Mountain View, CA ($20.74 estimated). | LWH calculation from BEA RPP 2024 (MARPP/SARPP), wage sources above, CBO inflation forecastResearch Bank F1253 | 2028 | Our estimate |
| $18.65 | Portland, ME ($19.00 set in law for Jan 1, 2028). | LWH calculation from BEA RPP 2024 (MARPP/SARPP), wage sources above, CBO inflation forecastResearch Bank F1254, F1268 | 2028 | Our calculation |
| $17.72 | Santa Fe, NM ($17.50 from Jan 1, 2027). | LWH calculation from BEA RPP 2024 (MARPP/SARPP), wage sources above, CBO inflation forecastResearch Bank F1257 | 2028 | Our calculation |
| $17.69 | Boulder, CO ($18.61 estimated). | LWH calculation from BEA RPP 2024 (MARPP/SARPP), wage sources above, CBO inflation forecastResearch Bank F1246 | 2028 | Our estimate |
| $17.37 | San Francisco, CA ($20.08 estimated July 2027 rate). | LWH calculation from BEA RPP 2024 (MARPP/SARPP), wage sources above, CBO inflation forecastResearch Bank F1256 | 2028 | Our estimate |
| $17.28 | Connecticut ($17.90 estimated). | LWH calculation from BEA RPP 2024 (MARPP/SARPP), wage sources above, CBO inflation forecastResearch Bank F1248 | 2028 | Our estimate |
| $17.14 | Washington, D.C. ($18.84 estimated July 2027 rate). | LWH calculation from BEA RPP 2024 (MARPP/SARPP), wage sources above, CBO inflation forecastResearch Bank F1262 | 2028 | Our estimate |
| $16.97 | Washington State ($18.16 estimated). | LWH calculation from BEA RPP 2024 (MARPP/SARPP), wage sources above, CBO inflation forecastResearch Bank F1261 | 2028 | Our estimate |
| $16.85 | Chicago, IL ($17.46 estimated July 2027 rate). | LWH calculation from BEA RPP 2024 (MARPP/SARPP), wage sources above, CBO inflation forecastResearch Bank F1247 | 2028 | Our estimate |
| $16.63 | Minneapolis, MN ($17.43 estimated). | LWH calculation from BEA RPP 2024 (MARPP/SARPP), wage sources above, CBO inflation forecastResearch Bank F1252 | 2028 | Our estimate |
| $16.62 | Rhode Island ($17.00 in 2027; no 2028 raise set). | LWH calculation from BEA RPP 2024 (MARPP/SARPP), wage sources above, CBO inflation forecastResearch Bank F1255 | 2028 | Our calculation |
| $16.61 | Los Angeles, CA ($18.86 estimated July 2027 rate). | LWH calculation from BEA RPP 2024 (MARPP/SARPP), wage sources above, CBO inflation forecastResearch Bank F1251 | 2028 | Our estimate |
| 13 more places | Also above $16.37, not charted (Edgewater, Burien, Tukwila, Renton and others): 28 places in all, so “at least two dozen.” | LWH calculation (BEA RPP 2024; Miller Nash WA local rates; ADP; Nixon Peabody; Littler; Burien, Boulder County official pages)Research Bank F1259 | 2028 | Our estimate |
| Close but below | Portland, OR metro $16.32 · California $16.09 · Vermont $15.59 · New Jersey $15.51 · New York City area $15.47. | LWH calculation (BEA RPP 2024; state labor departments)Research Bank F1260 | 2028 | Our estimate |
| × 1.024 | CBO’s forecast of 2027 inflation, used to estimate 2028 wages where the rate isn’t set yet. | Congressional Budget Office, economic projections Jan 2026 (via American Action Forum, Jan 13, 2026)Research Bank F1232 | 2027 | From the source, check pending |
| About 2.7–4.0% | Recent yearly raises in indexed places (Chicago +2.7%, Denver +2.9%, Connecticut +3.2%, Flagstaff +3.3%, Washington +3.5%, Seattle +3.9%, Minneapolis +4.0%), above the 2.4% used, so the estimates are likely low. | Our calculation from city and state minimum wage ratesResearch Bank F1448 | 2026→2027 | Our calculation |
How we got it. Each place’s minimum wage on Jan 1, 2028 ÷ its 2024 price level (BEA Regional Price Parity, U.S. = 100; metro areas for cities, states for states). Where the 2028 rate isn’t set, our estimate is the latest announced rate × 1.024 (CBO’s 2027 inflation forecast). Recent yearly raises in these places ran higher, so the estimates are likely low. Yearly = the after-prices hourly figure × 2,080.
Also in the full story
Charts that appear only on the full story page.
Full story · $18 isn’t enough
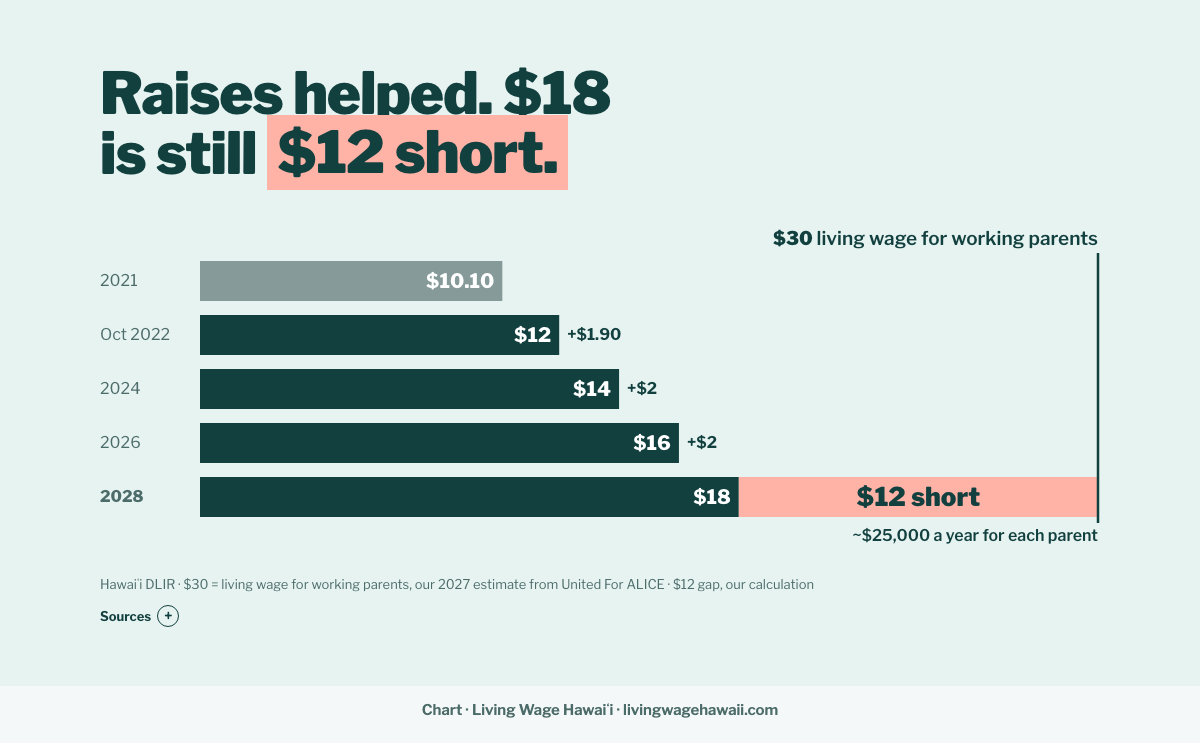
Raises helped. $18 is still $12 short.
| Number | What it means | Source | Year | Status |
|---|---|---|---|---|
| $10.10 → $12 → $14 → $16 → $18 | Minimum wage: since 2018, Oct 1 2022, Jan 1 2024, Jan 1 2026, Jan 1 2028. Nothing is scheduled after 2028. | Hawaiʻi DLIR; Act 114 (2022)Research Bank F0001, F0005 | 2018–2028 | Checked against the source |
| ~$30 an hour | A living wage for each of two working parents in a family of four (two adults, an infant and a preschooler). $124,500 a year ÷ 2 parents ÷ 2,080 hours = $29.92. | Our estimate from United For ALICE (State of ALICE in Hawaiʻi 2026) and DBEDT’s price forecastResearch Bank F0102, F0435, F0056 | 2027 | Our estimate |
| $62,400 a year | $30 × 2,080 hours. | Our calculationResearch Bank F0534 | 2027 | Our calculation |
| $12 short · $24,960 a year | $30 − $18, × 2,080 hours. | Our calculationResearch Bank F0534 | 2028 | Our calculation |
How we got it. Raises since 2021: $18 − $10.10 = $7.90 (our calculation).
Full story · Leaving
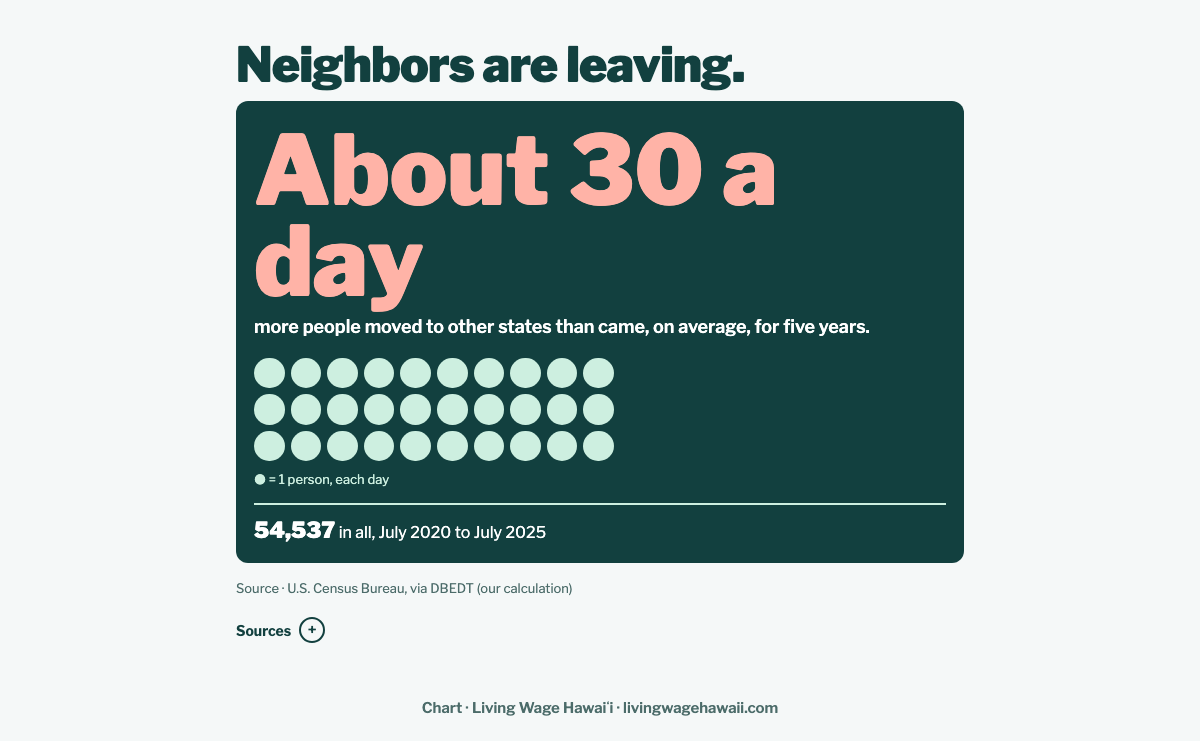
Neighbors are leaving.
| Number | What it means | Source | Year | Status |
|---|---|---|---|---|
| 54,537 | Net moves from Hawaiʻi to other states, five years: −9,849, −15,999, −11,327, −8,486, −8,876. | DBEDT / Census Vintage 2025Research Bank F0474 | July 2020–July 2025 | Checked against the source |
| About 30 a day | 54,537 ÷ 1,826 days. | Our calculation from U.S. Census Bureau via DBEDTResearch Bank F1186 | July 2020–July 2025 | Our calculation |
How we got it. Counts moves, not reasons. Moves to and from other countries are not included.
Full story · What a raise does
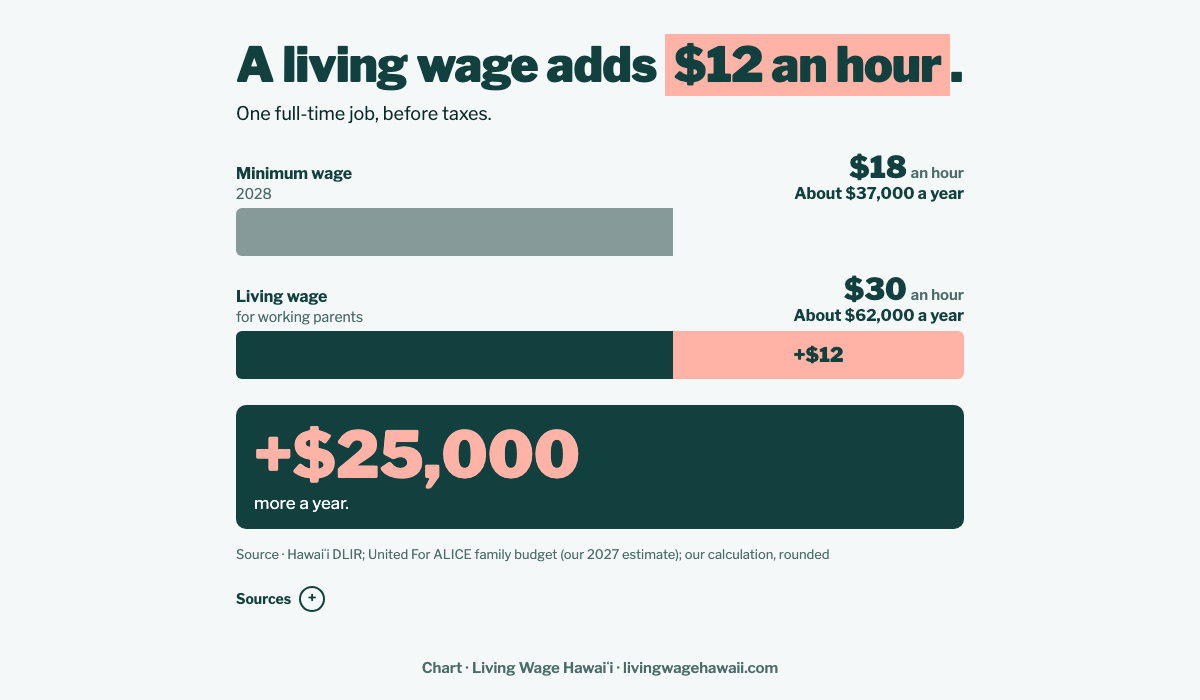
A living wage adds $12 an hour.
| Number | What it means | Source | Year | Status |
|---|---|---|---|---|
| $18 | Hawaiʻi’s minimum wage from Jan 1, 2028, the last raise in current law (Act 114 of 2022). Today it is $16. | Hawaiʻi DLIR; Act 114 (2022)Research Bank F0002, F0005 | 2028 | Checked against the source |
| ~$30 an hour | A living wage for each of two working parents in a family of four (two adults, an infant and a preschooler). $124,500 a year ÷ 2 parents ÷ 2,080 hours = $29.92. | Our estimate from United For ALICE (State of ALICE in Hawaiʻi 2026) and DBEDT’s price forecastResearch Bank F0102, F0435, F0056 | 2027 | Our estimate |
| About $37,000 → about $62,000 | One full-time job at $18 and at $30 ($37,440 → $62,400), shown to the nearest $1,000. | Our calculationResearch Bank F0022, F0534 | 2028 | Our calculation |
| +$25,000 more a year | $24,960, shown rounded. | Our calculationResearch Bank F0534 | 2028 | Our calculation |
How we got it. Yearly = hourly × 2,080 hours, before taxes.
Full story · Common questions
Common questions
| Number | What it means | Source | Year | Status |
|---|---|---|---|---|
| 57% women | Share of workers earning $22 an hour or less who are women (56.5%). | DBEDT, Minimum Wage in Hawaiʻi: 2025 Update (Table E-1, ACS 2023)Research Bank F0291 | 2023 | Checked against the source |
| +38% vs +20% | Restaurant and bar locations, Hawaiʻi vs U.S. (+38.1% vs +19.8%). | Our calculation from BLS QCEWResearch Bank F1210 | 2015–2025 | Our calculation |
| +4.8% vs +10.7% | Restaurant and bar jobs, Hawaiʻi vs U.S. | Our calculation from BLS QCEWResearch Bank F1207 | 2015–2025 | Our calculation |
| +81% vs +34% | Minimum wage ($7.75 → $14) vs Honolulu prices. | Our calculation from Hawaiʻi DLIR, U.S. DOL and BLSResearch Bank F0020 | 2015–2025 | Our calculation |
| +36% | U.S. prices over the same years (index 135.8, 2015 = 100). | Our calculation from BLSResearch Bank F0033 | 2015–2025 | Our calculation |
Only on this page
More detail for lawmakers, reporters and anyone who wants the full picture.
Only on this page · The gap
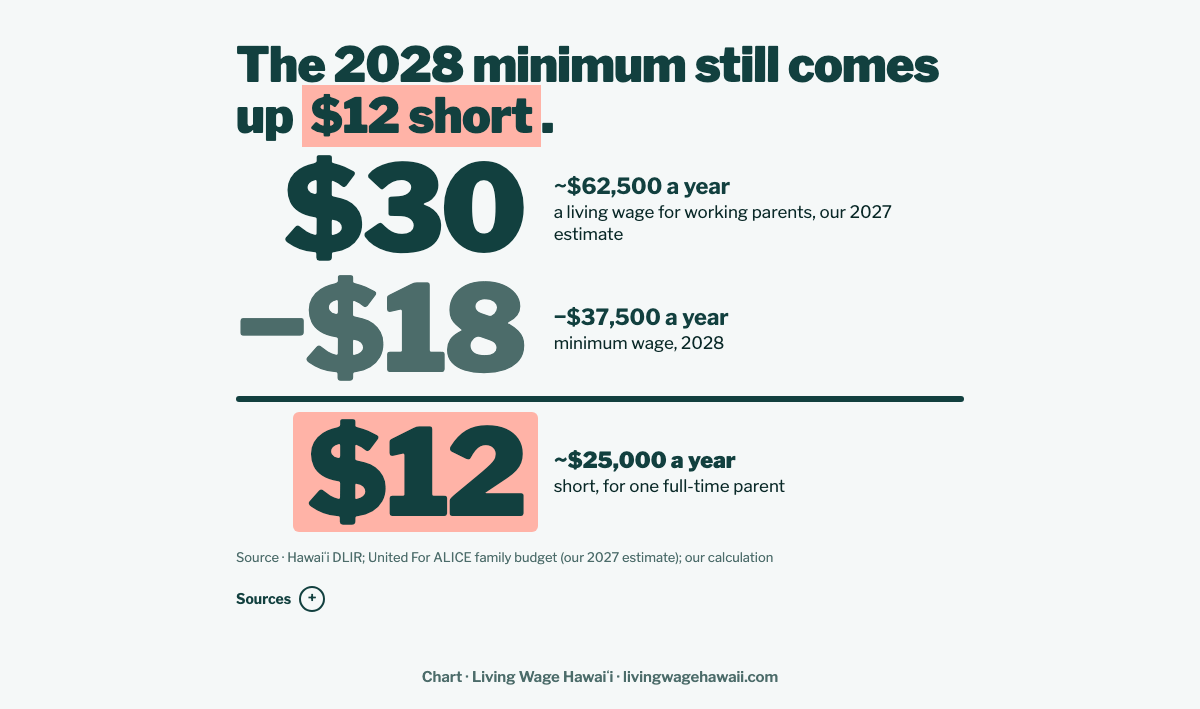
The 2028 minimum still comes up $12 short.
| Number | What it means | Source | Year | Status |
|---|---|---|---|---|
| $30 · ~$62,500 a year | A living wage for working parents ($62,400 full time), shown to the nearest $500. | Our estimate from United For ALICE and DBEDTResearch Bank F0534, F0102 | 2027 | Our estimate |
| −$18 · −$37,500 a year | The 2028 minimum wage ($37,440 full time), shown to the nearest $500. | Our calculation from Hawaiʻi DLIRResearch Bank F0022, F0002 | 2028 | Our calculation |
| $12 · ~$25,000 a year | Short, for one full-time parent: $12 × 2,080 = $24,960. | Our calculationResearch Bank F0534 | 2028 | Our calculation |
| $18 | Hawaiʻi’s minimum wage from Jan 1, 2028, the last raise in current law (Act 114 of 2022). Today it is $16. | Hawaiʻi DLIR; Act 114 (2022)Research Bank F0002, F0005 | 2028 | Checked against the source |
| $112,704 | United For ALICE Household Survival Budget for a Hawaiʻi family of four (two adults, an infant and a preschooler), at 2024 costs. | United For ALICE, State of ALICE in Hawaiʻi 2026Research Bank F0435 | 2024 | Checked against the source |
| ~$124,500 a year | That family budget carried to 2027 with DBEDT’s Honolulu price forecast ($124,466). | Our estimate from United For ALICE and DBEDTResearch Bank F0102 | 2027 | Our estimate |
How we got it. $30 is our 2027 estimate: the United For ALICE family-of-four budget ($112,704 at 2024 costs) carried to 2027 with DBEDT’s Honolulu price forecast (about $124,500), split over two full-time parents (2,080 hours each) = $29.92 an hour. It measures need. It is not a number in any bill. Yearly figures are rounded to the nearest $500.
Only on this page · Aid and tax breaks
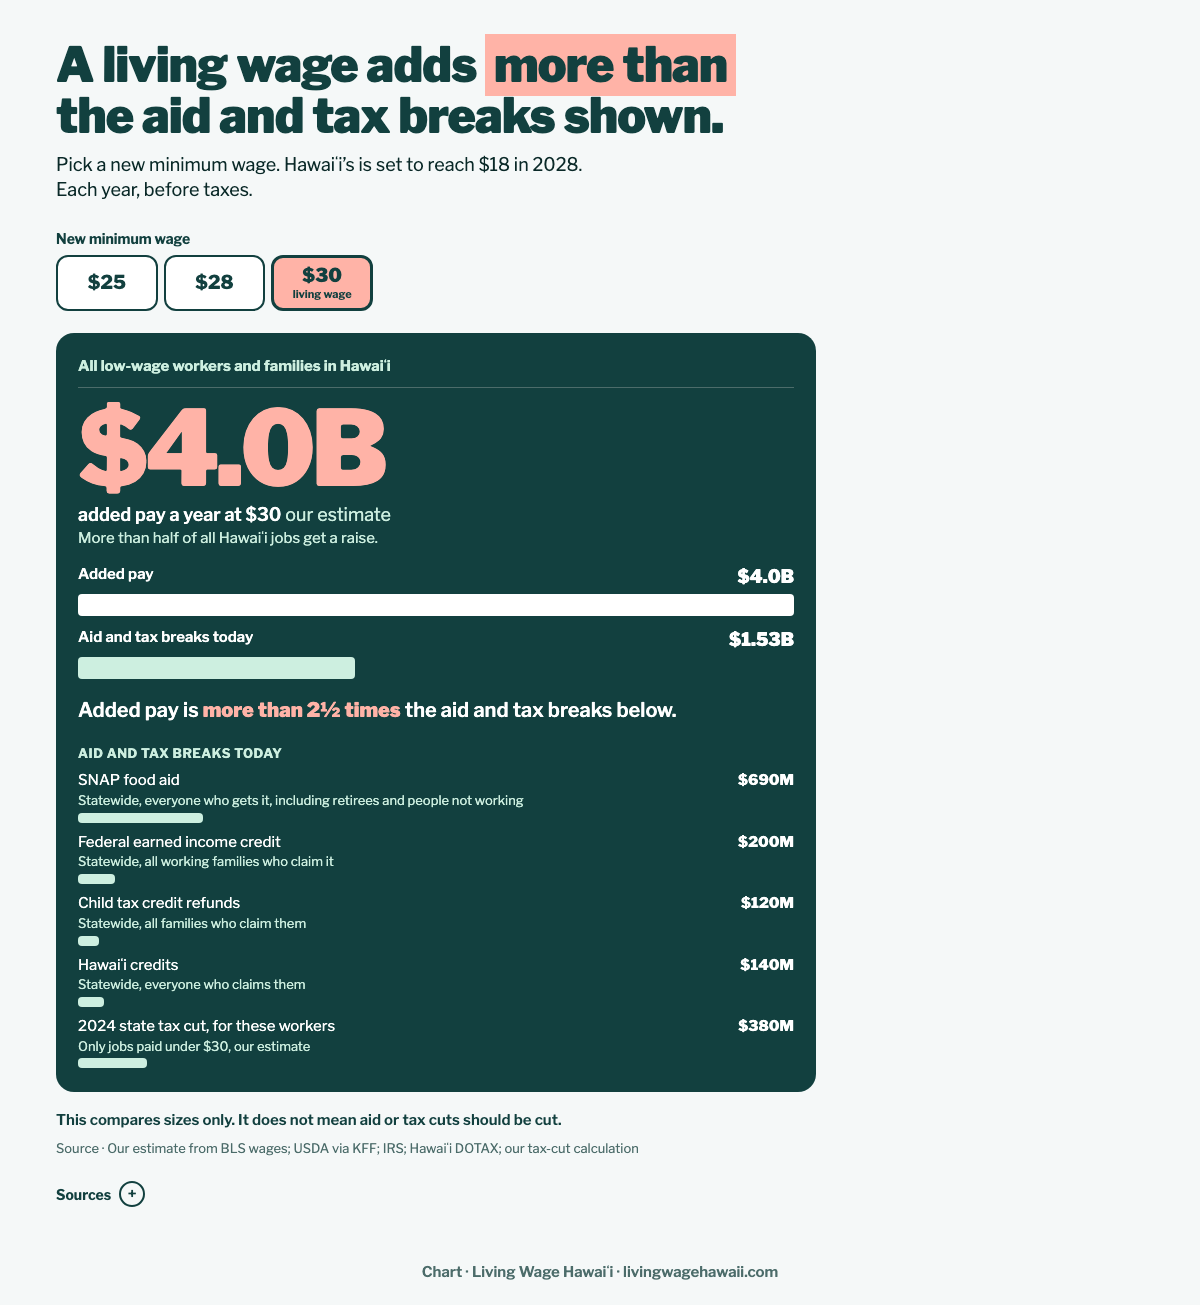
Added pay compared with aid and tax breaks, statewide
| Number | What it means | Source | Year | Status |
|---|---|---|---|---|
| $4.0B | Added pay a year if every Hawaiʻi job paid under $30 were raised to $30 (from the $18 minimum). Range $3.67–5.16 billion. | Our estimate (LWH Raise Estimate Method Memo, BLS wage data)Research Bank F1382, F0545 | 2027 wages | Our estimate |
| More than half of jobs | About 335,000 jobs get a raise at $30, 53% of 627,530. | Our estimate from BLS OEWSResearch Bank F1382, F0299 | May 2025 wages | Our estimate |
| $1.53B | Aid and tax breaks today, the five rows below added up ($1,529.3 million exact). | Our calculationResearch Bank F1400 | Mixed years | Our calculation |
| More than 2½ times | $3,953 million ÷ $1,529.3 million = 2.58. | Our estimateResearch Bank F1400 | Mixed years | Our estimate |
| $690M | SNAP food aid in Hawaiʻi, everyone who gets it ($686.96 million). | KFF / USDA FNSResearch Bank F0434 | FY2025 | Checked against the source |
| $200M | Federal earned income credit claimed in Hawaiʻi ($200.7 million). | IRS Statistics of Income, Historic Table 2 (state data), HawaiʻiResearch Bank F1324 | Tax year 2023 | Checked against the source |
| $120M | Refunded child tax credit in Hawaiʻi ($117.1 million). | IRS Statistics of Income, Historic Table 2 (state data), HawaiʻiResearch Bank F1325 | Tax year 2023 | Checked against the source |
| $140M | Hawaiʻi refundable earned income and food/excise credits ($141.0 million). | Hawaiʻi DOTAX, Tax Credits Claimed TY2023Research Bank F0432 | Tax year 2023 | Checked against the source |
| $380M | The part of the 2024 state income tax cut going to jobs paid under $30 ($383.5 million; range $312–486 million). | Our estimate from DOTAX rules and BLS wagesResearch Bank F1409 | Tax year 2028 | Our estimate |
| $922.7 million | The whole 2024 tax cut for all taxpayers (no longer shown on the chart, named in Sources). | Council on Revenues report to the Governor (DOTAX estimate)Research Bank F1352 | FY2028 | Checked against the source |
| 7.6% | Hawaiʻi workers holding more than one job, taken off the tax-cut estimate because the wage data counts jobs, not people. | State of Hawaiʻi Data Book 2024, Table 12.24 (BLS Current Population Survey microdata, DBEDT calculations)Research Bank F1383 | 2024 | Checked against the source |
| $1.8B · $3.0B | Added pay at $25 and $28, the other picks ($1.77 billion, range $1.60–2.41B; $3.00 billion). | Our estimateResearch Bank F1438, F1381 | 2027 wages | Our estimate |
| $270M · $340M | Tax cut for jobs under $25 and $28 ($267.1 million; $338.0 million). | Our estimateResearch Bank F1439, F1408 | Tax year 2028 | Our estimate |
| About $1,180 · $1,216 · $1,239 a job | Tax cut per job under $25, $28 and $30 (single filers, before the 7.6% second-job adjustment). | Our estimateResearch Bank F1445, F1446, F1447 | Tax year 2028 | Our estimate |
| $201.6M · $272.5M · $322.8M | Married sensitivity: the tax cut under $25, $28 and $30 if each job’s pay were a couple’s only income, filing jointly (less 7.6%). Smaller, because the old joint brackets already taxed low pay lightly. | Our estimateResearch Bank F1442, F1443, F1444 | Tax year 2028 | Our estimate |
| About 1¼ times · about 2 times | Added pay compared with the aid and tax breaks shown, at $25 and $28. | Our estimateResearch Bank F1437, F1399 | Mixed years | Our estimate |
How we got it. Added pay is our estimate from the LWH Raise Estimate Method Memo (Nov 2026): BLS wages for 22 job groups (May 2025) carried forward 7% to 2027, 1,500 hours a year because many low-wage jobs are part time, every job under the new wage raised to it, no ripple raises. The four program rows are statewide totals for everyone who gets them, not only workers who would get a raise. Health coverage (Med-QUEST), TANF, WIC and school meals are left out. This compares sizes only. It does not mean aid or tax cuts should be cut.
Only on this page · School test scores
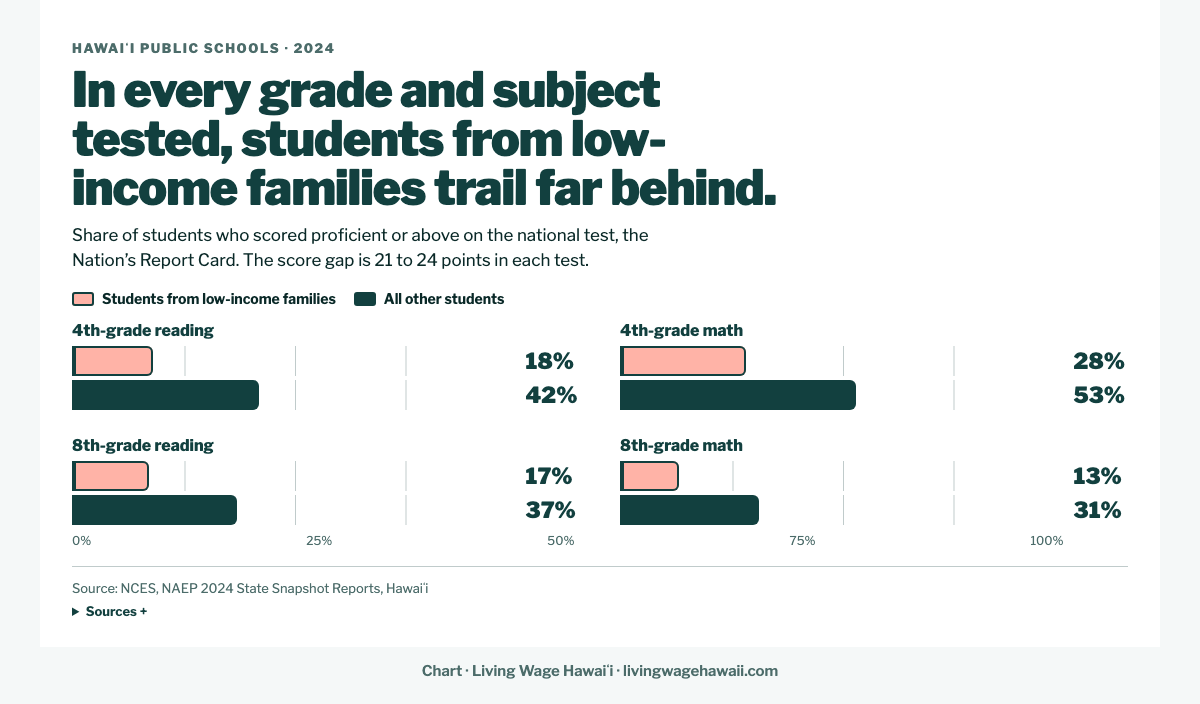
Test scores: students from low-income families and everyone else
| Number | What it means | Source | Year | Status |
|---|---|---|---|---|
| 18% vs 42% | 4th-grade reading: students from low-income families vs other students scoring proficient or above. | NCES, NAEP 2024 State Snapshot (Hawaiʻi)Research Bank F1457 | 2024 | Checked against the source |
| 28% vs 53% | 4th-grade math, same comparison. | NCES, NAEP 2024 State Snapshot (Hawaiʻi)Research Bank F1458 | 2024 | Checked against the source |
| 17% vs 37% | 8th-grade reading, same comparison. | NCES, NAEP 2024 State Snapshot (Hawaiʻi)Research Bank F1456 | 2024 | Checked against the source |
| 13% vs 31% | 8th-grade math, same comparison. | NCES, NAEP 2024 State Snapshot (Hawaiʻi)Research Bank F1455 | 2024 | Checked against the source |
How we got it. NAEP (the Nation’s Report Card) tests a sample of Hawaiʻi public school students, including charter schools. “Low-income families” is NAEP’s “economically disadvantaged” group, flagged from school records (formerly free or reduced-price lunch). NAEP Proficient is a high bar and does not mean “at grade level.” This shows a gap between groups, not what causes it.
All numbers in one file: lwh-all-numbers.csv. Found a mistake? Write to info@livingwagehawaii.com.